

Cost to Serve in DSD: Why Your Biggest Customers May Not Be Your Most Profitable
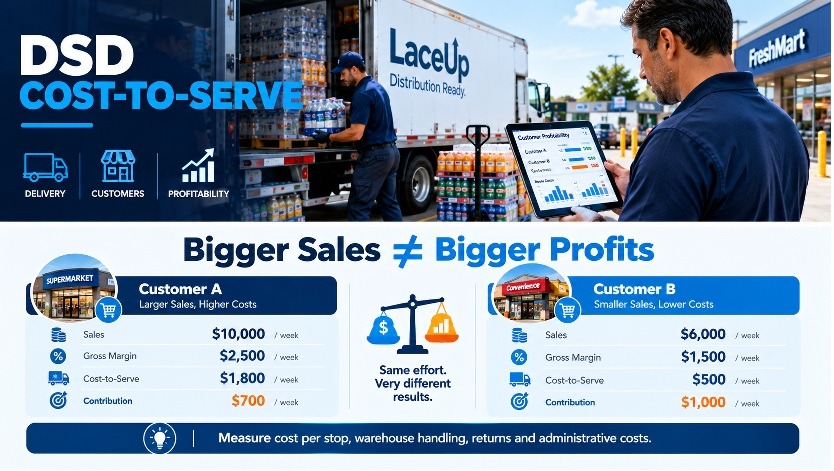
In Direct Store Delivery, distributors often measure customer importance by sales volume. The largest accounts receive priority, frequent deliveries, special discounts, and additional services. But high sales do not always mean high profits. A customer generating $10,000 in weekly sales may be less profitable than another purchasing $6,000. The difference is often hidden in the cost of servicing each account. In this article I cover how understanding DSD Cost to Serve helps distributors identify those hidden expenses and make better decisions about pricing, delivery frequency, and customer profitability.
Cost To Serve: The Hidden Costs Behind Every Delivery
The cost of serving a customer goes far beyond the products being sold. Every order generates activities: order processing, warehouse picking, truck loading, transportation, unloading, invoicing, payment collection, and sometimes returns or credits. Consider two customers purchasing similar products:
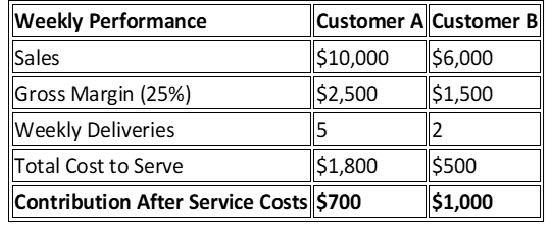
llustrative example. Service costs include allocated delivery, warehouse, and administrative expenses.
Customer A generates substantially more revenue, yet Customer B contributes $300 more after service costs. The problem is not necessarily the customer’s sales volume. It is the relationship between gross margin and the resources required to serve the account.
Cost To Serve: What Should Distributors Measure?
An effective DSD Cost to Serve analysis should consider four major factors.
Delivery frequency and cost per stop. Frequent deliveries increase driver time, fuel consumption, and unloading expenses. Five small deliveries may cost considerably more than two consolidated orders.
Warehouse and order processing. Small orders containing many SKUs require more picking, handling, and administrative work relative to their value.
Returns and delivery exceptions. Rejected products, shortages, damaged goods, and invoice corrections generate additional costs that traditional sales reports may overlook.
Commercial conditions. Discounts, promotions, special handling, and extended payment terms can further reduce profitability.
Understanding these costs allows distributors to evaluate customers based on contribution rather than revenue alone.
From Route KPIs to Customer Profitability
Many distributors already monitor route sales, cases delivered, stops completed, and delivery times.
But these KPIs do not automatically reveal profitability. A route may generate excellent sales while serving customers that require excessive time, frequent returns, or unusually high delivery costs.
DSD Cost to Serve connects operational performance with financial results through indicators such as Cost per Stop, Cost per Case, Sales per Stop, Returns Rate, and Customer Contribution. For example, reducing deliveries from five to three per week for selected customers could lower transportation costs without compromising service. Other opportunities include consolidating orders, establishing minimum quantities, adjusting delivery schedules, or reviewing customer-specific pricing.
The objective is not to eliminate expensive customers. It is to serve them more profitably.
How DSD Technology and AI Nova Turn Data into Profitability Insights
Calculating customer profitability requires information from sales, warehouse
operations, delivery routes, and accounting. LaceUp DSD and Route Accounting
software captures essential operational data, including deliveries, returns,
credits, truck inventory, and sales activity. Integration with WMS and ERP
systems provides the foundation for measuring service costs and operational
KPIs.
But collecting data is only the first step. Managers also need to understand what those numbers mean.
This is where Nova, LaceUp’s AI Agent integrated directly into its DSD environment, introduces a new dimension. Through AI-powered reporting, Nova helps distributors interact with operational information and gain insights without relying exclusively on traditional reports. A manager investigating customer profitability may want to understand which accounts require frequent deliveries, which routes generate unusually high returns, or where sales per stop appear insufficient to justify delivery costs. AI-assisted reporting can help explore these patterns using available operational data, while complete customer profitability calculations also require financial costs and appropriate allocation rules.
Conclusion
Revenue tells a distributor who buys the most. It does not tell them who is worth serving. Measuring what each customer costs, down to the stop, replaces assumptions with facts, and it turns pricing, route design, and delivery frequency into decisions backed by data. The distributors who do this rarely end up firing many customers. They end up with routes that make more money from the same trucks and the same drivers.
At LaceUp Solutions, our DSD Route Accounting Software, and Route Management capture deliveries, invoices, returns, and credits on one shared record as work happens, which is the data foundation customer-level profit depends on. These capabilities, couples with our AI Nova system, gives distributors the tools to make the proper decisions to optimize the cost to serve. Subscribe to the LaceUp Blog for weekly insights, or contact us to see how LaceUp can help your operation get ahead of this year’s Q4 before it gets ahead of you.
I hope this article has been helpful. I will continue to post information related to management, distribution practices and trends, and the economy in general. Our channel has a lot of relevant information. Check out this video on “How to Master Reporting in Distribution with Nova AI”.
Sorry, the comment form is closed at this time.