

Improve your efficiency with the right Distribution KPIs
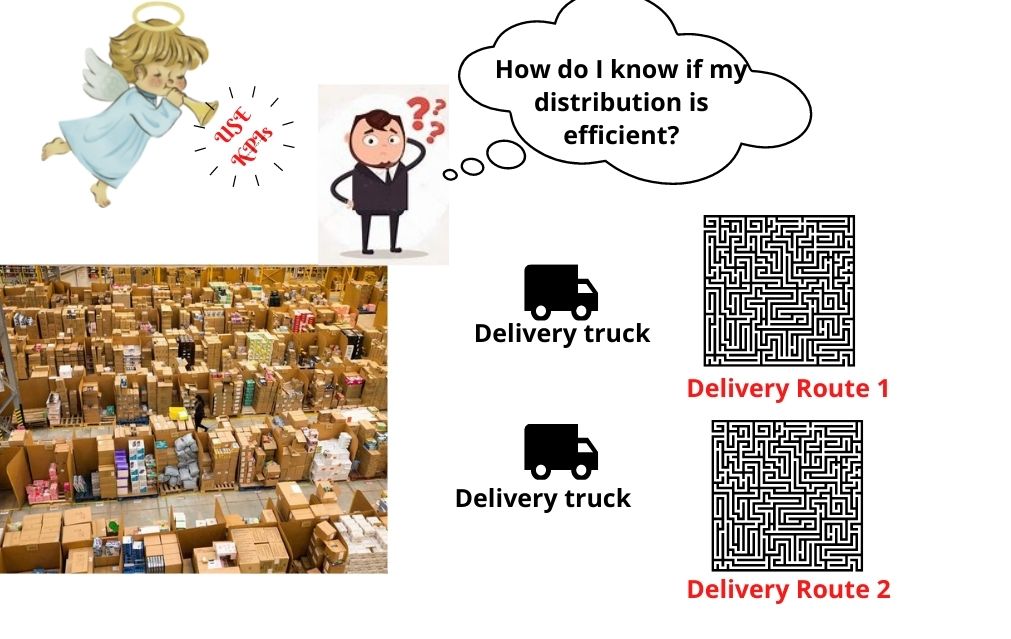
Distribution companies, be it B2B or B2C, normally work with very little net profits, in the range of 3 to 5%, and most of the costs lie in the warehouse and delivery processes. For this reason, it is of paramount importance to have a lean and efficient performance in those areas by using the right Distribution KPIs for your operation.
There is an old saying in management that goes “what is not measured cannot be controlled”. Many measurements have been used to evaluate the efficiency of a distribution operation. The main thing is to select which of these represents the Key Performance Indexes (KPIs) of your operation and establish a system to evaluate and optimize them, taking related actions. In this article, I will list the most commonly used Distribution KPIs and how they can help you increase your profits. In subsequent articles, I will delve into the most relevant KPIs for each of the main processes of a distribution operation.
What is a KPI and why is it so important?
Key Performance Indicators (KPIs) are the critical (key) indicators of progress toward an intended result. KPIs provide a focus for strategic and operational improvement, create an analytical basis for decision making, and help focus attention on what matters most. The primary difference between a KPI and a metric is that a KPI explains what is being measured, while a metric is the numeric value of the measure itself.
A good set of KPIs will give you the tools to:
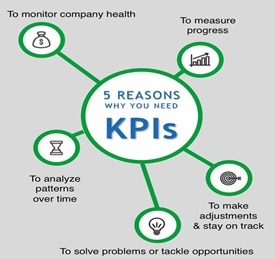
- Monitor the health of the company
- Measure the evolution of your goals
- Make proper adjustments and corrective action plans
- Solve problems and detect opportunities to improve
- Analyze trends and patterns
There are several features that a KPI must have in order to be considered appropriate for your operation, but the main ones are:
- Easy to understand
- Easy to measure
- In line with the company’s strategies
- It may be hard to accomplish but it must be achievable
- Visible across the organization
The most commonly used Wholesale and Distribution KPIs
I classify the Distribution KPIs into four groups:
- Sales Productivity Indexes (SPI): They measure the performance of the sales reps at the stores.
- Warehouse Management Indexes (WMI): Indexes related to the warehouse, inventory efficiency, and the picking process.
- Route Monitoring Indexes (RMI): they measure the efficiency and profitability of the routes.
- Product Profitability Indexes (PPI): these indexes deal with portfolio profitability.
Sales Productivity KPIs
The KPIs to measure the effectiveness of the sales process vary depending on the distribution model of your company. For B2B companies with DSD, sales are made by sales Reps in assigned stores. In this model, it is important to measure how effective sales are, how much from the portfolio is sold, the results of promotions made in the store, etc. However, for the B2B eCommerce model, the customer places orders directly from your eCommerce platform, so you need to measure the effectiveness of your marketplace marketing strategy. Below is a partial list of the most common Sales KPIs.
- Sale per sale reps: Measure the sales volume per route over a period
- Numeric Distribution per store: Measures the number of products sold by the store vs the authorized products in the store. This index lets you know the effectiveness of the sales rep per store/chain.
- Order Cycle Time: it is the average span between the placing of one order and the next for a given customer. This index lets you know how efficiently each store is managed.
- Returns Due to damaged or expired products: this metric lets you know if the store has been oversold.
- Sales Conversion Rate: refers to the total number of B2B eCommerce sales vs the total visits to your website.
- Repeat rate: measures the number of customers visiting your site again.
- Average order value: it is the average of orders over a certain period.
- Refund and Return rate for B2B eCommerce model.
Route Delivery Distribution KPIs
The ultimate goal of a Route Delivery System is to minimize travel time. So, RMIs aim to measure the processes related to this goal.
- Drop Size: Measures the average value of orders delivered per route in a period and helps you determine the profitability of the route.
- The number of stores per day: it is the number of stops of a truck in a day.
- Average time stop: measures the time spent by the truck at each stop.
- Gas per mileage: computes the cost of gas in a period vs the miles traveled in that period.
- On-Time Delivery Rate: this index measures the number of orders delivered in the agreed time vs the total orders.
Warehouse and Inventory KPIs
The Warehouse Management Indexes are used in a normal distribution B2B operation to optimize warehouse and inventory efficiency. These are the most commonly used.
- Inventory Accuracy: measures the ratio of goods in your database that don´t match the actual physical inventory.
- Picking Accuracy: this index measures the correctly picked orders vs the total picked orders.
- Returns Due to Improper Shipment: it tracks the number of returns due to improper items being shipped.
- Backorder rate: Measures the rate at which orders are being made for out-of-stock items.
- Check-in time: Tracks the average amount of time required to place a received purchase order in its BIN location.
Distribution KPIs related to Profitability
The Profitability Monitor Indexes (PMIs) deal with the metrics that impact the profit of the operation. These indexes touch all the previously analyzed processes, i.e, profit on sales, warehouse, inventory, and routes.
- Product profitability: measures the gross profit per item.
- Store profitability: this index compares the average sales per store versus the Drop Size goal.
- Inventory Turnover: measures the number of times the entire inventory moves through the warehouse over a specific period. This index gives information on how efficient your purchase policies are for a given product.
- Truck Cost-Sales Ratio: Tracks the incidence of the truck cost on the sales for a route.
- Route profitability: this index determines the ratio between all the costs of the route and the sales delivered in that route.
- Labor and Equipment Utilization: Measures the rate at which your workforce and equipment are being utilized in the warehouse.
- Storage Productivity: tracks the amount of occupied warehouse space vs the total available space.
Conclusion
The only way to ensure that your distribution company is as profitable as it can be is by monitoring the efficiency of your operation´s key processes. This is achieved by the Key Performance Indexes or KPIs. I have outlined the 25 most commonly used KPIs in the industry; however, it does not mean you have to monitor all of them. What you may do is select the most crucial KPIs for your operation and set clear goals and a monitoring process for them. I will address this issue in my next article.
I hope this article has been helpful. I also hope it helps you select the best KPIs and optimize your operation. I will continue to publish information related to Warehouse Management, distribution practices, and the general economy. If you are interested in this article or you would like to learn more about Laceup Solutions, please register to keep you updated on future articles.
You can also watch the video about the blockchain’s impact on distributors.
Sorry, the comment form is closed at this time.